Last spring, when the coronavirus sent financial markets into a tailspin, many investors expected Warren Buffett would go bargain hunting. Instead, the legendary investor actually sold billions of dollars’ worth of airline, banking and other economically sensitive stocks into the market panic. By May of 2020, Buffett’s Berkshire Hathaway had accumulated a record $137 billion cash hoard. When shareholders questioned this stockpiling of cash, rather than buying into the market, Buffett simply responded:
We have not done anything because we don’t see anything that attractive to do.
Fast forward a few months later, and the Oracle of Omaha finally found something attractive – Dominion Energy, a Virginia-based electric utility company. Specifically, Berkshire (NYSE:BRK.A) acquired Dominion’s (NYSE:D) natural gas pipeline and storage assets in a $10 billion transaction, giving the conglomerate control over 18% of all interstate natural gas flows in the U.S. The transaction also provided Berkshire with significant exposure to liquefied natural gas (LNG), including 25% stake in Cove Point LNG – one of only six U.S. LNG terminals.
But Buffett’s gas buying spree didn’t stop there…
A few months later, in August, Berkshire spent another $7 billion buying up stakes in five Japanese commodities trading companies. This included Mitsui and Mitsubishi, which own stakes in the Cameron and Cove Point U.S. LNG export terminals. The deal also provided Berkshire with exposure to U.S. natural gas assets that feed into these terminals.
At the time of these purchases, gas prices (NYSEARCA:UNG) were hovering around multi-decade lows, and countless journalists and financial pundits were declaring the “Death of Fossil Fuels.” But as you’ll see in today’s article, it’s now clear what Buffett knew when he put billions of dollars to work betting on natural gas, even despite the economic uncertainty of a global pandemic, which is…
The outlook for U.S. natural gas is brighter today than at any time since the dawn of the shale revolution.
Not only is natural gas economically resilient, but it will enjoy decades of future demand growth as part of the world’s transition to a cleaner economy. Meanwhile, the supply side of the equation has never looked more bullish – both in the short and long term. As I’ll show in today’s article, the U.S. natural gas market has entered into a structural deficit, setting the stage for sustained higher prices ahead.
Finally, I’ll explain how I’m capitalizing on this new bull market, while avoiding many of the pitfalls involved with ETFs, futures and E&P companies. First, let’s begin by winding back the clock to this time last year, to see how the U.S. gas market fared in the wake of the 2020 pandemic and what’s driving the market into a deficit in 2021.
Natural Gas – an Economically Resilient Commodity
When the Coronavirus lockdowns began in March of 2020, energy markets crashed across the board, including natural gas. By June of 2020, prices for the U.S. benchmark Henry Hub natural gas fell to as low as $1.44 per million cubic feet (Mcf). Before the Coronavirus, Bill Clinton was President the last time gas prices traded so low. Now, here’s the thing…
You don’t typically see gas prices take such a big hit during economic slowdowns. Why? Because most natural gas is used for heating and electricity. And during an economic downturn, most people find other places to cut expenses before they stop heating their homes or using electricity. Compare this with oil demand, which is primarily used as a feedstock for transportation fuels like gasoline and kerosene (i.e. jet fuel).
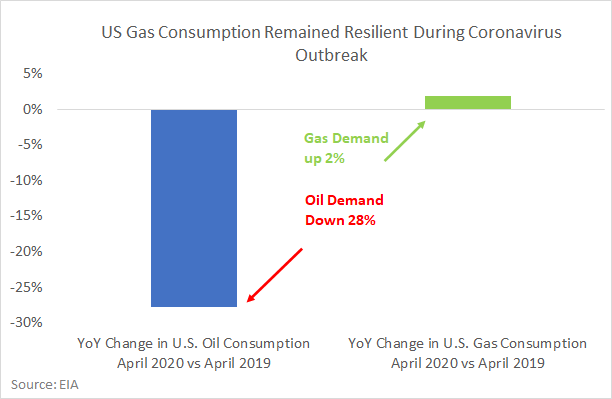
During economic downturns, travel is one of the first places consumers and businesses cut spending on – especially during a global pandemic. That explains why U.S. oil consumption collapsed by nearly 30% when the economy shut down in April of 2020, whereas natural gas consumption remained stable – actually increasing by 2%:
So if domestic gas consumption actually held up during the economic shutdowns last year, what explains the price crash? Three words: liquefied natural gas (LNG). This supercooled, highly compressed form of natural gas can be transported around the world on specially designed ships. Thus, LNG exports have facilitated a growing global gas export trade, connecting energy-hungry economies with low-cost gas producers. Given the abundance of low-cost U.S. gas reserves, it’s perhaps no surprise to learn that…
America Becomes a Global Gas Superpower
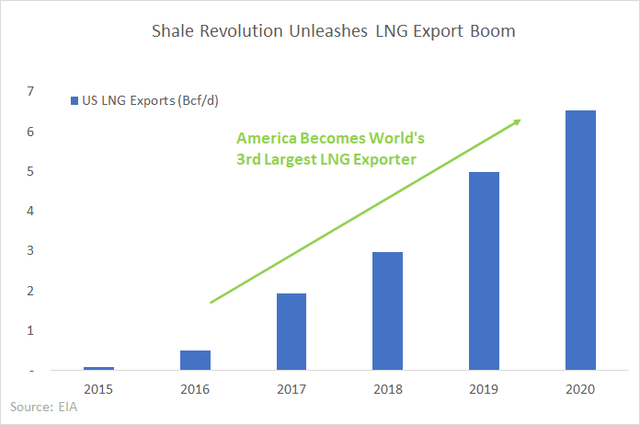
The growth in U.S. LNG exports is perhaps one of the greatest, and largely untold success stories of the shale revolution. As recently as 2015, the industry was virtually non-existent. But in just five short years, U.S. LNG exports have surged to an average of 6.5 Bcf/d last year – making America the third largest exporter of liquefied gas in the world:
The key factor fueling this trend is the transition from coal to cleaner-burning natural gas in power plants around the world. In China alone, the Ministry of Ecology and Environment recently pushed to convert over 7 million households from coal to gas-powered electricity, as part of a three-year “Blue Sky Defense” plan proposed back in 2018.
Similar movements are playing out in other major energy-hungry economies, like India, Japan and all across Europe. This trend shows no signs of stopping anytime soon, with more than a decade and a half of runway. A recent McKinsey research report projects that global gas demand will continue growing through the mid-2030s – more than any other fossil fuel.
LNG exports will provide a critical linkage between gas producing and consuming countries. McKinsey projects that LNG demand will grow at 3.4% per year out to 2035, while noting that “supply in key gas markets will not keep up with demand growth…with more than 200 million metric tons of new (LNG) capacity required by 2050.”
America’s position as one of the lowest-cost gas producers on the planet will make it a leading provider of cleaner burning fuel to the planet in the decades ahead. The International Energy Agency projects that the U.S. will become the world’s largest LNG exporter by 2025. And if you read the tea leaves, that’s the same bet Warren Buffett is making with his multi-billion-dollar exposure to U.S. gas pipelines and export infrastructure.
With that long-term backdrop in mind, let’s zoom into the shorter-term picture over the last 12 months.
LNG Surplus Transforms into Deficit
Despite the positive long-term demand story for gas as a power source, it’s role as a heating fuel means winter weather fluctuations can dominate the supply/demand picture in the short run. The extremely mild 2019/2020 winter in both Europe and Asia is a perfect example – when plunging demand for gas heating created a short-term LNG supply glut. This made the LNG market particularly vulnerable going into the spring of 2020, when the Coronavirus outbreak only exacerbated the situation.
Facing an oversupplied market, U.S. LNG exports plunged by over 60%, from 8.1 Bcf/d in January 2020 to 3.1 Bcf/d in July 2020. That single factor alone caused a roughly 5% drop in U.S. gas demand, offsetting the modest increase in domestic consumption, and thus sending prices into a tailspin. However, winter weather fluctuations can go both ways. Fast forward to the 2020/2021 winter season, and unseasonably cold weather in Asia flipped the LNG market from oversupply into a deficit- sending Asian LNG prices to record highs. As the market balanced, U.S. LNG exports recovered towards new record highs of 10.8 Bcf/d by December 2020 – or roughly 10% of domestic gas supply:
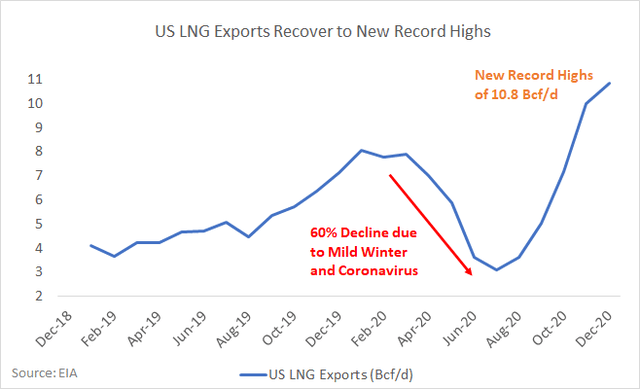
So despite the short-term disruption from mild winter weather, compounded by the Coronavirus, LNG exports have already recovered to new record highs in recent months. Meanwhile, U.S. domestic consumption remained resilient throughout the Coronavirus pandemic. Thus, the bottom line is that U.S. natural gas demand is not only resilient but will also enjoy a secular growth tailwind from LNG exports in the years ahead.
Next, let’s turn our attention to the supply side of the equation.
Falling U.S. Gas Production Creates Supply Deficit
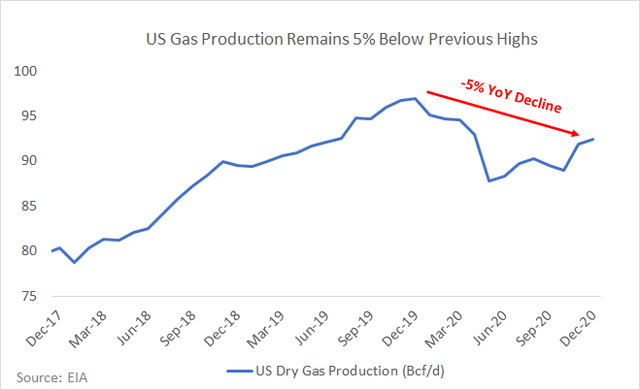
As the old saying goes in commodities markets, “the cure for low prices is low prices.” With natural gas falling well below the marginal cost of production in the spring and summer of 2020, drilling ground to a halt across the U.S. By May of 2020, producers had removed 9.2 billion cubic feet per day (Bcf/d) from the market – nearly 10% off the prior peak of 97 Bcf/d reached in December of 2019.
Gas output started coming back online in June, recovering to 92.4 Bcf/d by December 2020 (the latest official data from EIA). Despite this recovery, U.S. production remains 4.6 Bcf/d below the prior peak of 97 Bcf/d reached in December 2019 – exiting 2020 down roughly 5% on a year-on-year basis:
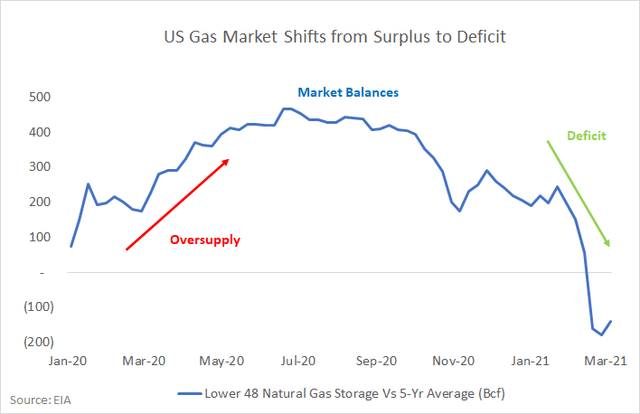
Putting it all together… stable domestic consumption plus new record high LNG exports against declining production has shifted the U.S. gas market from surplus into deficit. We can measure this supply deficit via gas inventories versus the five-year average. The chart below shows the evolution from an oversupplied market in the first half of 2020 into a persistent deficit exiting 2020, and accelerating into early 2021:
Of course, the million-dollar question going forward is…
Is this Time Different?
Specifically, can we trust shale drillers not to unleash a flood of new production that will oversupply the market, and keep prices depressed going forward? After all, anyone making this bet at virtually any time in the last decade turned out to be dead wrong. I’m the first to admit falling into this trap, and I’ve got the brokerage statement scars to prove it. As a brief bit of background for those new to the shale patch, here’s what happened…
During the last decade, hundreds of billions of dollars went up in smoke in America’s shale patch. Both outside investors and shale insiders share in the blame. In search of the next great growth story in a world of zero interest rates, Wall Street allocated a seemingly endless supply of cheap capital to shale producers – a situation that never ends well, regardless of which industry the easy money flows into. Meanwhile, corporate boardrooms crafted compensation schemes that rewarded management teams for reckless growth, with little consideration of economic returns.
In public companies, C-suite bonuses were often tied to top line production. This incentivized growth and acquisitions, with no penalty for the negative cash flows and bloated balance sheets created along the way. In private markets, rapid production growth made you a juicy acquisition target, creating a self-reinforcing cycle of capital destruction. Much of the innovation that boosted well productivity over the last decade came with the cost of pouring ever more money downhole. Thus, the rise of 10,000-foot drilling laterals and “super fracked” wells, blasted with thousands of pounds of sand and other proppants. So while many oil and gas producers achieved impressive top line revenue growth, if often meant spending $1.10 to generate $1 in cash flow.
But that which can’t go on forever, typically doesn’t.
After a lost decade of negative returns in the shale patch, investors are no longer willing to throw good money after bad. Many have simply thrown up their hands and given up on the sector. Others have exited oil and gas for ESG reasons. The few remaining investors will not tolerate the previous “growth at all costs” business model. Instead, the new mantra in today’s shale patch is “show me the money”. But before shale producers can begin returning capital to shareholders, they must first redress their capital allocation sins of the past decade, by repairing broken balance sheets.
Lenders Force the Shale Patch into Submission
Unlike the last market downturn in 2016, lenders now find themselves stuck with the bill of unpayable debt, as the Wall Street Journal explains…
During the last oil-market downturn in 2015 and 2016, banks came out largely unscathed as producers sold off their assets or handed control over to bondholders… This time around, some bank lenders are finding out their collateral in the form of oil and gas assets isn’t worth enough to cover their debts as oil prices have decreased.
As a result, lenders have tightened credit standards, starving the shale industry of the critical capital needed for growth. This means leveraged E&Ps can no longer simply pay lip service to fiscal prudence. With credit no longer freely available, repairing broken balance sheets has now become a matter of survival. Gone are the days of abundant external capital available for chasing growth; many shale drillers must now divert any excess cash flows towards working down debt.
You can find clear evidence of this new industry reality in the latest quarterly conference calls among public E&P companies. Across the board, capital allocation discussions are now dominated by three priorities:
- Living within cash flows
- Shifting from growth towards maintenance levels of production and capex.
- De-leveraging balance sheets
To cite a few examples, let’s start with America’s largest dry gas producer – EQT (EQT) – whose management team noted the following strategic focus on the company’s Q4 conference call:
Our strategy remains unchanged, execute a maintenance program, enhance margins, grow free cash flow and de-lever the business… We will continue to paydown additional debt in 2022, until we are constantly trending below two times leverage.
Likewise, executives of Southwestern Energy (SWN) reiterated the same priorities on their latest earnings call:
Remaining financially disciplined, optimizing free cash flow at maintenance capital investment levels, reducing debt and achieving sustainable two times leverage… and we will continue to allocate free cash flow to debt reduction until we reach that goal.
Meanwhile, the capital allocation plan at Antero Resources (AR) involves flat capex spending for the next five years:
It’s a maintenance capital program for AR for the next five years. That is the plan certainly for now to generate maximum pre-cash flow and paydown our debt profile.
Finally, management at Range Resources (RRC) remain committed to holding production flat, per their Q4 2020 conference call:
The capital plan for 2021 is projected to maintain production (unchanged) at approximately 2.15 Bcf equivalent per day.
I could keep going, but you get the point. These are four of the largest gas-focused E&P companies, in the heart of Appalachia – America’s lowest-cost gas play. If they’re slamming on the brakes of capital investment, you can bet the same thing is happening with higher-cost producers in the Haynesville and other gas basins around the country.
Meanwhile, the few remaining companies with the balance sheet capacity to weather the storm – the supermajors like Chevron and Exxon – are also throwing in the towel on their previous growth ambitions.
The End of an Era: Supermajors Retreat from Shale Gas
Long time energy investors will recall Exxon’s bold foray into shale gas with the $36 billion XTO acquisition in 2010. The deal made Exxon the largest gas producer in America… and that was only the start. Over the next five years, XTO pursued an aggressive acquisition spree that tripled its asset base.
Fast forward a decade later, and Exxon now finds itself taking multi-billion-dollar asset impairments and slashing its exposure to shale gas. Investors in the company paid the price – with a decade of negative returns, and an increasingly fragile balance sheet, as net debt exploded from a pristine $4 billion in 2011 to nearly $70 billion today. So it’s perhaps unsurprising that Exxon is flipping the script, and now retreating from shale gas. This includes the company’s recent announcement to slash its North American capital expenditures towards dry gas production by half. As Natural Gas Intel reports:
The once-prized dry gas assets had been included in future development plans, but under the revised strategy there are no plans to develop ‘a significant portion’ of dry gas assets in Appalachia, Arkansas, Louisiana, Oklahoma, Texas and the Rocky Mountains, nor in some gas resources in Western Canada and Argentina.
Likewise, Chevron didn’t escape the shale boom without its share of multi-billion-dollar blunders. In 2010, Chevron acquired Atlas Energy in a $4.3 billion deal to acquire 1.1 million net acres in the Appalachian basin. At the time, with gas prices trading between $4 – $5 per Mcf, gas-rich Appalachian acreage traded for a premium. Fast forward to 2019, perpetual oversupply had kept gas prices trapped below $3 per Mcf for nearly half a decade. Thus, Chevron found itself taking an $8.2 billion impairment charge, largely from marking down its shale gas assets. In 2019, the company cut its losses and sold its half-million net acreage position in Appalachia to EQT for just $735 million – a small fraction of the original price per acre.
Novels could be written detailing the full scope of capital destruction in the shale patch over the last decade. But here’s the bottom-line going forward: the independent pure play gas producers are being forced into submission by their lenders. Most of these independents will be working for the banks and bondholders for at least the next couple of years and will thus be in no position to raise external financing for growth capex.
Meanwhile, supermajors like Chevron and Exxon are throwing in the towel and scrapping development plans for much of gas acreage altogether. These companies aren’t facing capital starvation from lenders, but their management teams are under just as much pressure from shareholders to maintain their dividends instead of chasing growth.
So, returning back to answer the original question…
Yes, it’s Different this Time
The capital impairment facing the U.S. energy industry is unlike anything we’ve seen since the dawn of the shale revolution. The rig count provides the single best metric for capturing this new reality, providing an indicator of the capital deployed for oil and gas production. In the chart below, note the striking difference between the V-shaped recovery in rig counts from the 2016 collapse versus the much more muted recovery in today’s capital starved environment:
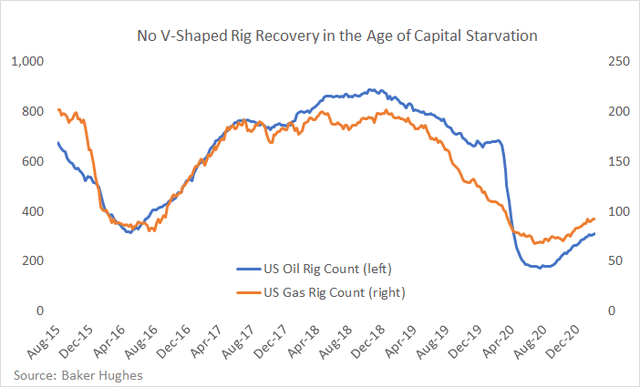
After the rig count bottomed in mid-2016, within nine months, U.S. drilling activity was approaching a full recovery. This time around, nine months after bottoming out in the summer of 2020, the U.S. rig remains depressed near the lows of the 2016 bottom. And that’s despite prices recently recovering above $60 per barrel of oil and $3 per Mcf of gas.
In the old shale regime, freely available capital gave rise to a “lower for longer” price environment. Today, capital starvation is now translating into “lower for longer” production and drilling activity. The EIA confirms this view, with their latest energy outlook calling for just 91.4 Bcf/d in U.S. dry gas production in 2021. If this projection holds…
2021 will mark the first back-to-back annual declines in U.S. gas production since the dawn of the shale revolution.
Given the ongoing stability in U.S. domestic gas consumption, plus new record highs in LNG exports, reduced supply should continue tightening the U.S. gas market through 2021 – 2022. Of course, weather will be the wildcard. Throw a cold winter into the mix, and the market could easily fall into a substantial supply deficit, requiring a spike in prices to balance the market. At the very least, all signs point towards sustained support for gas prices above $3 for the next couple of years. The EIA currently anticipates U.S. gas prices will average $3.14 in 2021 and $3.16 in 2022.
This leads to the final question – how to play it?
How I’m Playing the Coming Natural Gas Bull Market
Broadly speaking, the two most common approaches for expressing a view of higher natural gas include: 1) exchange traded funds (ETFs) and futures or 2) gas-focused E&P companies.
When you own a natural gas ETF, you really own continuous exposure to front month gas futures contracts. During a bull market, you will normally incur the cost of carry imbedded into the contango spread that develops across the futures curve (i.e. continuously selling out of expiring near-month contracts at lower prices and buying further-dated contracts at higher prices). At the moment, the natural gas curve is in backwardation, so it’s not a problem today. However, if the market begins pricing in tighter supply balances going forward, we should expect an inversion towards a contango term structure in gas futures.
If you buy into this view of a curve inversion towards natural gas contango, alongside a broader bull market in prices, it may present an interesting speculative opportunity to purchase individual futures contracts in the further out months in 2021 – 2022, as an example. The problem with this approach is that you’ll need mother nature to play ball. Recall from our earlier discussion that, during the winter months, weather becomes the dominant factor in shaping short term gas supply/demand and thus prices. Thus, an unusually mild warm winter could overwhelm an otherwise tight market, and crush prices. The challenge of navigating unpredictable weather fluctuations is one reason why natural gas trading is known as “the widowmaker” – it’s not an easy game.
For these reasons, most investors looking to express a long-term view on natural gas will likely find E&Ps as their preferred vehicle. Since these companies reflect the discounted cash flows over lifetime of the company, short-term price fluctuations become less meaningful. Of course, E&P investing comes with its own unique and equally daunting challenges, including…
Inventory – since buying shares in an E&P company means buying into the next 10-20 years of well inventory, that means making several critical assumptions regarding the value of that inventory. Can you trust management’s forecast regarding well spacing, drainage, and interference between parent and child wells? Can you trust that management is not extrapolating results from their Tier 1 inventory into lower-quality Tier 2 acreage?
Valuation – maybe the underlying assets are great, but are you buying them at a good enough price to earn a high return on your invested capital? This has become particularly challenging after the recent price rally across the energy complex.
Capital allocation – is management incentivized to act in the best interest of shareholders? Can you trust the C-suite to return capital to shareholders, instead of making an ill-timed acquisition, or recycling cash flows back into growth at the wrong point in the cycle? Are bloated G&A costs, including stock compensation, excessively eroding shareholder value?
Capital structure – given the bloated balance sheets across the sector, many E&Ps are now working for the banks and the bondholders. Only after leverage gets worked down over the next few years will shareholders start receiving a slice of the cash flow pie. In the meantime, without the prospect of direct shareholder returns, investors will need to rely on stock price appreciation. Again, after the recent rally across the energy complex, the prospect of buying low and selling high has become more challenging.
In other words, E&P investing presents a high hurdle between a gas bull market and your bottom line as an investor… and to quote Warren Buffett:
I don’t look to jump over 7-foot bars: I look around for 1-foot bars that I can step over.
In the past, regular readers will recall that I’ve focused a lot of my research on jumping over the 7-foot hurdle that is E&P investing. Now, I’m not saying that this approach can’t work… but when it comes to putting capital at risk, why engage in such a difficult game?
In today’s world of digital platforms and democratized access to alternative asset classes, individuals have an increasingly diverse array of options for oil and gas investing, beyond public equities. Now, you can…
Become Your Own Energy Company, Minus the Corporate Baggage
I’m talking about tapping into partnerships that provide direct access to the cash flow returns coming off the wellhead. Instead of buying into all of the corporate baggage of E&P companies, these partnerships can bypass the balance sheet risks and bloated cost structures often standing between shareholders and the cash flow streams from individual wells.
For example, partnership agreements can be structured to avoid risking your capital on the long line of expenses incurred before the well is ever drilled – including leasehold acquisitions, well-site infrastructure, corporate SG&A and other costs. Instead, you can lock in specified hurdle rates from the cash flowing directly from the wellhead. Meanwhile, you have the choice of investing into single or multi-well projects, with varying risk profiles and return targets. In this way, you can self-direct your energy exposure.
Of course, direct oil and gas investing alone doesn’t guarantee investment nirvana. Proper due diligence is required to vet project operators and the deal terms of any offering. That said, if you can find the right deal structure and proven operators – preferably ones that have a lot of skin in the game alongside you – then you can tilt the odds in your favor.
Personally, this type of direct energy exposure feels a lot more like the proverbial 1-foot hurdle to step over versus ETFs, futures and public E&P companies. That’s why I’ve exited 100% of my exposure to these instruments and will instead self-direct my energy exposure with this partnership approach. That said, monitoring the trends among public producers will remain critical for understanding the broader industry supply/demand dynamics, and thus the outlook for oil and gas prices.
Read it from seekingalpha


